What a Rapid-Fire VIX Double Means for Stocks
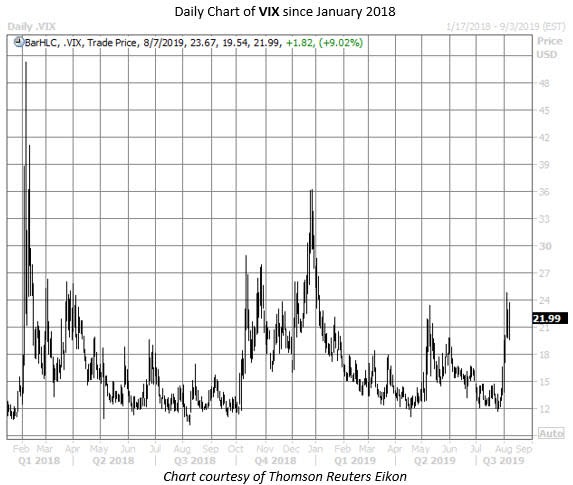
After falling every single day last week, stocks on Monday suffered their worst one-day sell-off of 2019, as the U.S.-China trade war came to a boil. As a result, the Cboe Volatility Index (VIX) -- also known as Wall Street's "fear gauge" -- skyrocketed into territory not charted since early January. In fact, the VIX's surge was so dramatic it set off a signal seen only four other times in the index's history. Below, we take a look at what that could mean for stocks over the next year.
The VIX settled at 12.07 on Wednesday, July 24; by Monday, Aug. 5, it had more than doubled to land at 24.59. Per Schaeffer's Quantitative Analyst Chris Prybal, there have been just five times ever when the VIX skyrocketed 100% or more in a matter of just eight sessions (not considering redundant signals).
The last time it happened was in mid-October 2018, at the start of the fourth-quarter sell-off. The VIX actually tripled in short order back in early February 2018, which marked the first signal since the August 2015 doldrums. In fact, it's interesting that three of the five signals happened in the month of August, with the first occurring in 2011.
A week after previous signals, the S&P 500 Index (SPX) was higher 100% of the time, averaging a gain of 2.6%. Though it's obviously a small sample size, that's far better than the index's average anytime one-week return of 0.2%, with 60% positive, looking at data since 2011. The S&P also racked up stronger-than-usual returns at the one-, three-, six-, and 12-month markers.

And, as you might've guessed from the encouraging SPX stats above, the famously mean-reverting VIX tends to cool off significantly after quick-and-dirty pops. In fact, the "fear index" averages a negative return at every single checkpoint, giving up an average of 22.9% one week later. That's compared to an average anytime one-week gain of 1.3% since 2011. By one year out, the VIX was down more than 60%, on average, compared to an average anytime annual return of 2.1%.
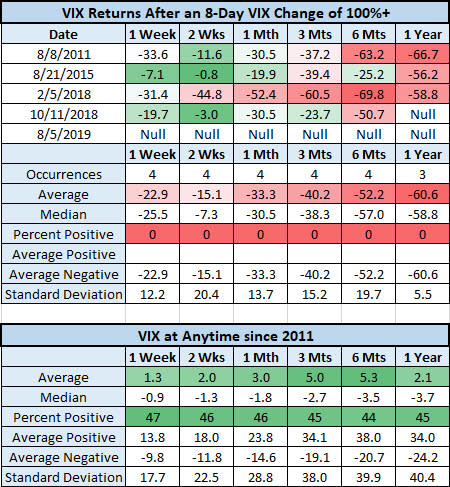
In conclusion, while stocks are significantly lower again today, history favors the bulls over the long haul after one of these signals. However, the market's near-term trajectory could depend on macro events, including U.S.-China trade negotiations -- expected to resume in September -- and Fed policy. In addition, volatility could remain a factor for a while; note that the standard deviation of S&P 500 returns after these VIX signals is higher than usual at nearly every checkpoint.
