Here's What You Should Know About The Hong Kong and China Gas Company Limited's (HKG:3) 1.9% Dividend Yield

Want to participate in a short research study? Help shape the future of investing tools and you could win a $250 gift card!
Is The Hong Kong and China Gas Company Limited (HKG:3) a good dividend stock? How would you know? Dividend paying companies with growing earnings can be highly rewarding in the long term. Yet sometimes, investors buy a stock for its dividend and lose money because the share price falls by more than they earned in dividend payments.
While Hong Kong and China Gas's 1.9% dividend yield is not the highest, we think its lengthy payment history is quite interesting. Some simple research can reduce the risk of buying Hong Kong and China Gas for its dividend - read on to learn more.
Click the interactive chart for our full dividend analysis
Payout ratios
Dividends are typically paid from company earnings. If a company pays more in dividends than it earned, then the dividend might become unsustainable - hardly an ideal situation. As a result, we should always investigate whether a company can afford its dividend, measured as a percentage of a company's net income after tax. In the last year, Hong Kong and China Gas paid out 58% of its profit as dividends. This is a fairly normal payout ratio among most businesses. It allows a higher dividend to be paid to shareholders, but does limit the capital retained in the business - which could be good or bad.
In addition to comparing dividends against profits, we should inspect whether the company generated enough cash to pay its dividend. Hong Kong and China Gas paid out 176% of its free cash flow last year, suggesting the dividend is poorly covered by cash flow. Paying out more than 100% of your free cash flow in dividends is generally not a long-term, sustainable state of affairs, so we think shareholders should watch this metric closely. While Hong Kong and China Gas's dividends were covered by the company's reported profits, free cash flow is somewhat more important, so it's not great to see that the company didn't generate enough cash to pay its dividend. Were it to repeatedly pay dividends that were not well covered by cash flow, this could be a risk to Hong Kong and China Gas's ability to maintain its dividend.
Is Hong Kong and China Gas's Balance Sheet Risky?
As Hong Kong and China Gas has a meaningful amount of debt, we need to check its balance sheet to see if the company might have debt risks. A rough way to check this is with these two simple ratios: a) net debt divided by EBITDA (earnings before interest, tax, depreciation and amortisation), and b) net interest cover. Net debt to EBITDA is a measure of a company's total debt. Net interest cover measures the ability to meet interest payments on debt. Essentially we check that a) a company does not have too much debt, and b) that it can afford to pay the interest. Hong Kong and China Gas has net debt of 2.82 times its earnings before interest, tax, depreciation, and amortisation (EBITDA). Using debt can accelerate business growth, but also increases the risks.
Net interest cover can be calculated by dividing earnings before interest and tax (EBIT) by the company's net interest expense. Net interest cover of 11.16 times its interest expense appears reasonable for Hong Kong and China Gas, although we're conscious that even high interest cover doesn't make a company bulletproof.
Remember, you can always get a snapshot of Hong Kong and China Gas's latest financial position, by checking our visualisation of its financial health.
Dividend Volatility
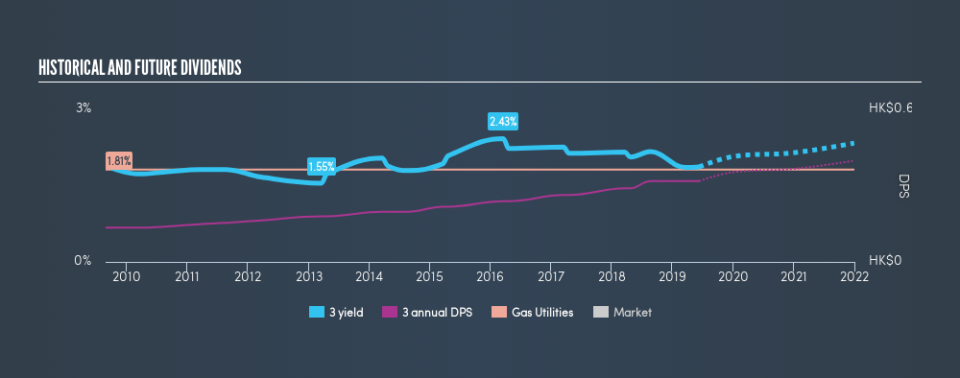
Before buying a stock for its income, we want to see if the dividends have been stable in the past, and if the company has a track record of maintaining its dividend. Hong Kong and China Gas has been paying dividends for a long time, but for the purpose of this analysis, we only examine the past 10 years of payments. During this period the dividend has been stable, which could imply the business could have relatively consistent earnings power. During the past ten-year period, the first annual payment was HK$0.13 in 2009, compared to HK$0.32 last year. This works out to be a compound annual growth rate (CAGR) of approximately 9.0% a year over that time.
Businesses that can grow their dividends at a decent rate and maintain a stable payout can generate substantial wealth for shareholders over the long term.
Dividend Growth Potential
Dividend payments have been consistent over the past few years, but we should always check if earnings per share (EPS) are growing, as this will help maintain the purchasing power of the dividend. Hong Kong and China Gas has grown its earnings per share at 6.3% per annum over the past five years. The rate at which earnings have grown is quite decent, and by paying out more than half of its earnings as dividends, the company is striking a reasonable balance between reinvestment and returns to shareholders.
Conclusion
Dividend investors should always want to know if a) a company's dividends are affordable, b) if there is a track record of consistent payments, and c) if the dividend is capable of growing. Hong Kong and China Gas gets a pass on its dividend payout ratio, but it paid out virtually all of its cash flow as dividends. This may just be a one-off, but we'd keep an eye on this. Earnings growth has been limited, but we like that the dividend payments have been fairly consistent. Ultimately, Hong Kong and China Gas comes up short on our dividend analysis. It's not that we think it is a bad company - just that there are likely more appealing dividend prospects out there on this analysis.
Earnings growth generally bodes well for the future value of company dividend payments. See if the 12 Hong Kong and China Gas analysts we track are forecasting continued growth with our free report on analyst estimates for the company.
We have also put together a list of global stocks with a market capitalisation above $1bn and yielding more 3%.
We aim to bring you long-term focused research analysis driven by fundamental data. Note that our analysis may not factor in the latest price-sensitive company announcements or qualitative material.
If you spot an error that warrants correction, please contact the editor at editorial-team@simplywallst.com. This article by Simply Wall St is general in nature. It does not constitute a recommendation to buy or sell any stock, and does not take account of your objectives, or your financial situation. Simply Wall St has no position in the stocks mentioned. Thank you for reading.
