Analysing candlestick patterns within cryptocurrency
What is a candlestick?
Candlestick patterns are visual indicators of how a security, derivative, or crypto asset has moved within a certain period. A period can be a minute, an hour, a week, a month, or any other set time frame. A basic candlestick is shown below.

Within the defined period, the opening price, closing price, as well as the period high and period low, are all plotted on the candlestick. The “lower shadows” and “upper shadows” can also be known as “wicks” or “tails”.
It is not known for certain who came up with the concept, however ,Munehisa Hommat from Japan used them when trading the Ojima Rice market in Osaka.
If the opening price is above closing price (in other words, the stock or crypto asset has declined in value for the period), then the traditional method would be to colour the candlestick red or black. In contrast, if the opening price is below the closing price (the asset has increased in value for the period), then the traditional colour chosen would be green. These red and green candlesticks for consecutive periods can then be plotted next to each other on a graph, to create a candlestick pattern.
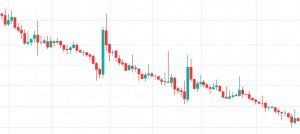
Candlestick pattern
How can I use these to trade crypto?
There are many complex patterns that can be observed using candlesticks, so below are some of the best for helping in your crypto trading. It should be noted that there are many more than listed here, but we have found these to help the most in crypto asset trading.
Harami
A large green body followed by a small red body (contained within large green body) would signify a bearish breakout when preceded by a downtrend. Conversely, a large red body followed by a small green body (contained within large red body) would signify a bullish breakout when preceded by an uptrend.

Dark Cloud Cover
A long green candlestick followed by a red candlestick that opens above the high of the green candlestick and closes near the middle of the green candlestick. This can be considered a bearish reversal signal, when it takes place during an uptrend.

Morning Star
This is when a large red bodied candlestick is followed by a small candlestick that can be red or green and falls below the large red bodied candlestick. Next, a green body candlestick appears that closes in the middle of the large red bodied candlestick, in the next period. If this appears at a bottom, it can signify a bullish reversal.

On Neckline
These occur in a downtrending market. They appear when a red candlestick is followed in the next period by a small bodied green candlestick, with its close near the bottom of the previous red candlestick. If the low of the green candlestick is penetrated, this is considered bearish.

Three Black Crows
This occurs when three red (or black) candlesticks appear in consecutive periods, all with lower closes. The prices at which the candlesticks close, are also near to the period low. So no – or small – wicks appear at the lower segment of each candlestick.

Conclusion
As with all trading analysis tools, they should be used with caution and an overall understanding of markets. No concept, including analysing candlestick patterns, is guaranteed to be successful. So as many in the crypto community warn, “DYOR” or Do Your Own Research!
The post Analysing candlestick patterns within cryptocurrency appeared first on Coin Rivet.
