How Financially Strong Is Roper Technologies Inc (NYSE:ROP)?

The size of Roper Technologies Inc (NYSE:ROP), a $28.62B large-cap, often attracts investors seeking a reliable investment in the stock market. Doing business globally, large caps tend to have diversified revenue streams and attractive capital returns, making them desirable investments for risk-averse portfolios. However, the key to their continued success lies in its financial health. Today we will look at Roper Technologies’s financial liquidity and debt levels, which are strong indicators for whether the company can weather economic downturns or fund strategic acquisitions for future growth. Remember this is a very top-level look that focuses exclusively on financial health, so I recommend a deeper analysis into ROP here. View our latest analysis for Roper Technologies
How much cash does ROP generate through its operations?
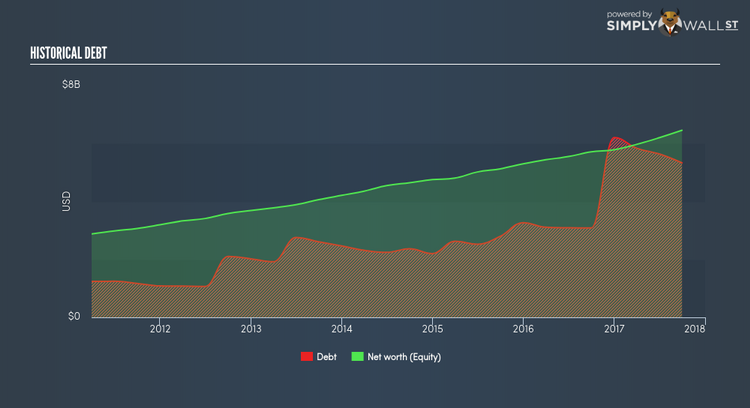
ROP’s debt levels surged from $3,271.2M to $6,209.5M over the last 12 months , which is made up of current and long term debt. With this growth in debt, the current cash and short-term investment levels stands at $757.2M for investing into the business. Moreover, ROP has produced cash from operations of $963.8M during the same period of time, leading to an operating cash to total debt ratio of 15.52%, meaning that ROP’s operating cash is not sufficient to cover its debt. This ratio can also be interpreted as a measure of efficiency as an alternative to return on assets. In ROP’s case, it is able to generate 0.16x cash from its debt capital.
Can ROP pay its short-term liabilities?
At the current liabilities level of $1,445.3M liabilities, it seems that the business has been able to meet these obligations given the level of current assets of $1,776.5M, with a current ratio of 1.23x. Usually, for Industrials companies, this is a suitable ratio since there’s sufficient cash cushion without leaving too much capital idle or in low-earning investments.
Can ROP service its debt comfortably?
With a debt-to-equity ratio of 82.59%, ROP can be considered as an above-average leveraged company. This is common amongst large-cap companies because debt can often be a less expensive alternative to equity due to tax deductibility of interest payments. Consequently, larger-cap organisations tend to enjoy lower cost of capital as a result of easily attained financing, providing an advantage over smaller companies. No matter how high the company’s debt, if it can easily cover the interest payments, it’s considered to be efficient with its use of excess leverage. Preferably, earnings before interest and tax (EBIT) should be at least three times as large as net interest. In ROP’s case, the ratio of 6.92x suggests that interest is well-covered. High interest coverage serves as an indication of the safety of a company, which highlights why many large organisations like ROP are considered a risk-averse investment.
Next Steps:
ROP’s debt and cash flow levels indicate room for improvement. Its cash flow coverage of less than a quarter of debt means that operating efficiency could be an issue. However, the company exhibits an ability to meet its near-term obligations, which isn’t a big surprise for a large-cap. This is only a rough assessment of financial health, and I’m sure ROP has company-specific issues impacting its capital structure decisions. I suggest you continue to research Roper Technologies to get a more holistic view of the stock by looking at:
1. Future Outlook: What are well-informed industry analysts predicting for ROP’s future growth? Take a look at our free research report of analyst consensus for ROP’s outlook.
2. Valuation: What is ROP worth today? Is the stock undervalued, even when its growth outlook is factored into its intrinsic value? The intrinsic value infographic in our free research report helps visualize whether ROP is currently mispriced by the market.
3. Other High-Performing Stocks: Are there other stocks that provide better prospects with proven track records? Explore our free list of these great stocks here.
To help readers see pass the short term volatility of the financial market, we aim to bring you a long-term focused research analysis purely driven by fundamental data. Note that our analysis does not factor in the latest price sensitive company announcements.
The author is an independent contributor and at the time of publication had no position in the stocks mentioned.
