Energy Sector On Fumes?
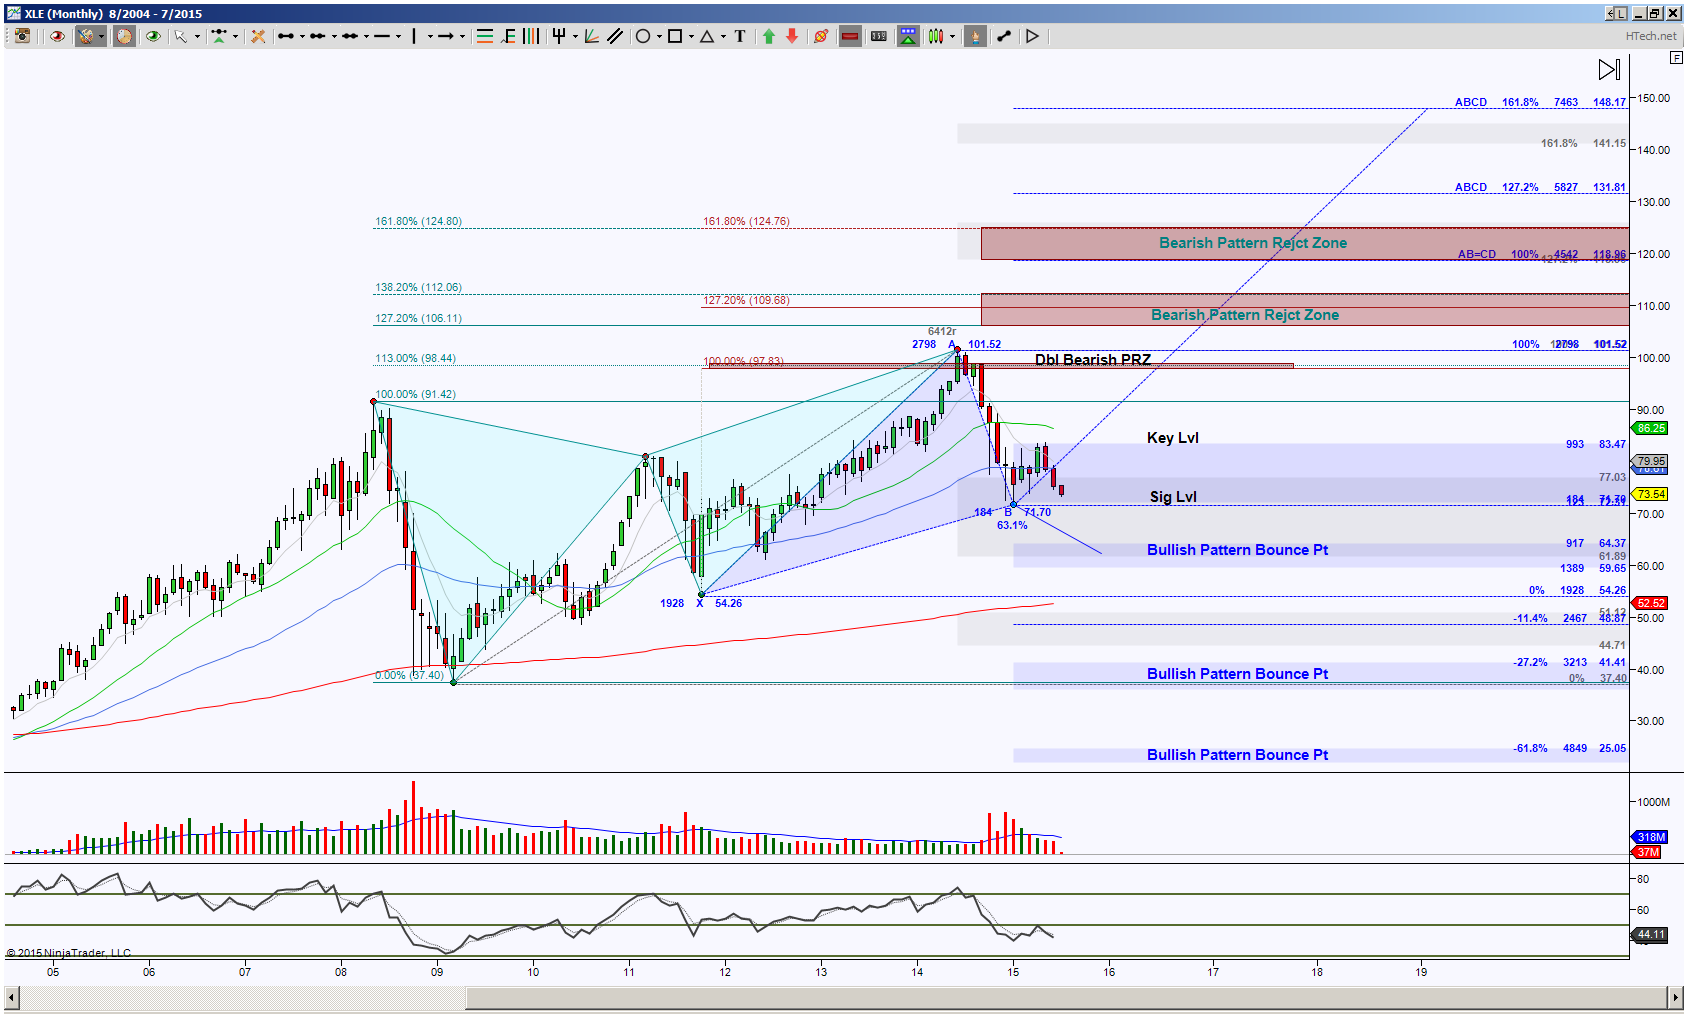
The Month chart, a bigger picture for XLE, the energy sector ETF, shows price has been in retracement mode of a double bearish harmonic pattern. There are initial levels of importance to watch for a break and hold, either above 77.03, then more important above 83.47 to increase the probability of testing noted upside Zones or below 71.70 to increase the probability of downside continuation with targets of significance at 64.37, 54.26 and 37.40. I interpret these targets as probable bounce points, especially if momentum concurs.
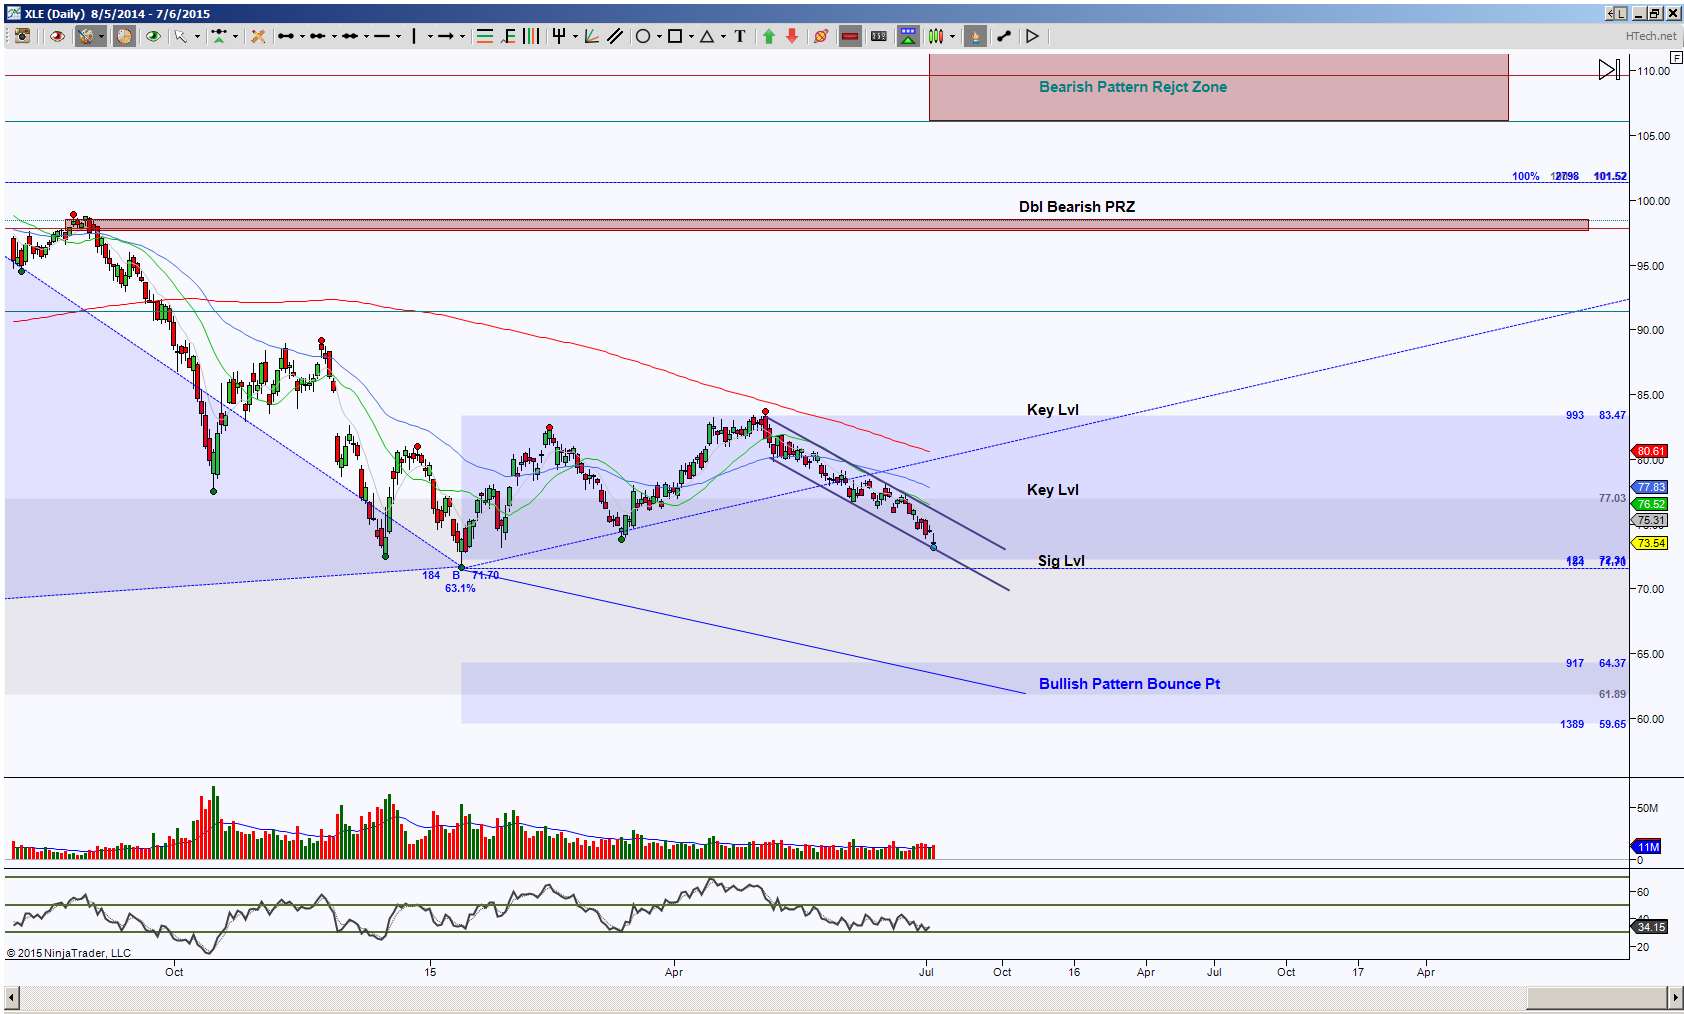
The Day chart shows price has been in a channeling motion as approaches the 71.70 Significant Level. There’s indication of price running on fumes even though there’s clear downside bias. This tells me that there needs to have some oomph to push below 71.70. Likewise a bounce off 71.70 or hold above the channel support has the channel resistance line as the target but will need some oomph to push above there, then more important hold above 77.03. As long as price holds below 77.03, the bias remains to the downside but be aware that unless price can push below 71.70, there’s a potential shift to sideways motion. It’s really not until price can hold above 77.03, then more important above 83.47 does the probability occur to shift the bias to upside.
Trading involves substantial risk and is not suitable for all investors. Past performance is not indicative of future results.
